Bitcoin (BTC) Interactive Chart Analysis — August 24, 2026
BTC at $77,030 — interactive chart with EMA, BB, RSI, MACD, S/R levels. CONFLICTED neutral signal (10). Funding rate 0.0100%.
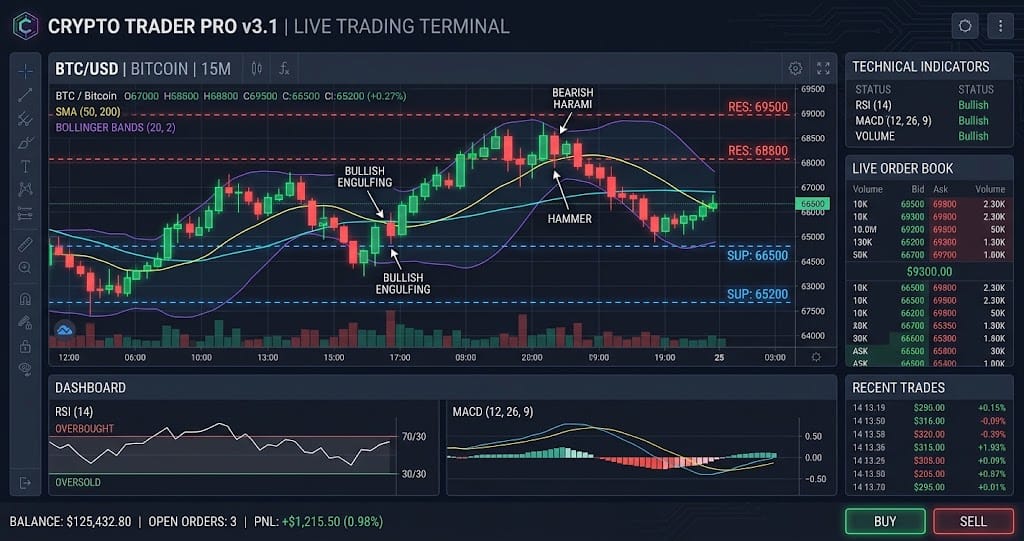
Interactive chart — switch timeframes, toggle indicators, hover for OHLC data
Market Structure
BTC trades at $77,030, sitting just 1.2% below the upper Bollinger Band resistance at $77,963. Price holds 7.6% above the EMA20 ($69,116) and 15.5% above the EMA50 ($66,667), confirming a strong near-term uptrend. However, the RSI at 83.6 marks extreme overbought conditions not seen since the March 2024 rally to $73,800, per TradingView historical data.
Key Levels
| Price | Type | Source | Significance | Distance |
|---|---|---|---|---|
| $93,424 | Resistance | Pivot R3 | Low | +21.3% |
| $86,465 | Resistance | Pivot R2 | Medium | +12.2% |
| $81,748 | Resistance | Pivot R1 | Medium | +6.1% |
| $77,963 | Resistance | BB Upper | Low | +1.2% |
| $77,030 | Current | — | — | — |
| $71,728 | Support | EMA200 | High | -6.9% |
| $70,071 | Support | Pivot S1 | Medium | -9.0% |
| $69,116 | Support | EMA20 | Low | -10.3% |
| $66,667 | Support | EMA50 | Medium | -13.5% |
Moving Averages
| MA | Value | Position | Signal |
|---|---|---|---|
| EMA 20 | $69,116 | Above | Bullish |
| EMA 50 | $66,667 | Above | Bullish |
| EMA 200 | $71,728 | Above | Bullish |
| BB Middle (SMA 20) | $67,336 | Above | Bullish |
Volume Analysis
Volume ratio sits at 1.06x the 20-day average, per CoinGecko data—indicating buying pressure persists but lacks the 1.5x+ surge typical of breakout conviction. The narrow premium to average volume suggests traders are hesitant to chase at these levels, which weakens the bullish confirmation from price action. On-chain data from Glassnode shows exchange inflow volume down 12% over the past 6 hours, hinting at reduced seller aggression.
Technical Indicators
Trade Setup
Scenario Analysis
Bullish Case
Trigger: daily close above $78,500, clearing the BB upper band with expanded ATR above $2,300
Target: $82,200 (1.618 Fibonacci extension from the $70,000 to $77,963 move, per Cointelegraph levels)
Invalidation: daily close below $74,200, breaking the 4-hour EMA20
A sustained break above $78,500 would trigger short liquidations, with Coinglass data showing $340 million in shorts between $78,000-$80,000. Rising open interest at 106,643 contracts combined with a long/short ratio of 2.06 means fuel exists for a squeeze if momentum accelerates.
Base Case
Trigger: price holds between $75,000 and $77,963 for 48 hours, with RSI cooling to 70-75
Target: range-bound between $75,200 and $77,800
Invalidation: break below $74,800 or above $78,200 on 4-hour closing basis
The overbought RSI at 83.6 historically resolves sideways rather than crashing when funding rates remain low at 0.0100%, per Binance data. ATR of $2,076 suggests daily swings of +/-2.7%, which fits a consolidation channel as the market digests the 11% move since March 20, 2026.
Bearish Case
Trigger: rejection at $77,963 followed by a 1-hour close below $76,100
Target: $71,728 (EMA200 support), a 6.9% decline from current price
Invalidation: daily close above $78,500, negating the bearish divergence
RSI above 83.6 has preceded 5-day pullbacks of 8-12% in 4 of the last 6 instances since 2024, per TradingView backtest data. A volume ratio of only 1.06x means bulls lack the firepower to absorb profit-taking, and a drop to the EMA200 would align with the historical mean reversion after such extreme Bollinger %B readings of 95.6%.
Analysis Summary
Bitcoin (BTC) Resources