Solana (SOL) Interactive Chart Analysis — August 26, 2026
SOL at $96.39 — interactive chart with EMA, BB, RSI, MACD, S/R levels. CONFLICTED neutral signal (15). Funding rate 0.0055%.
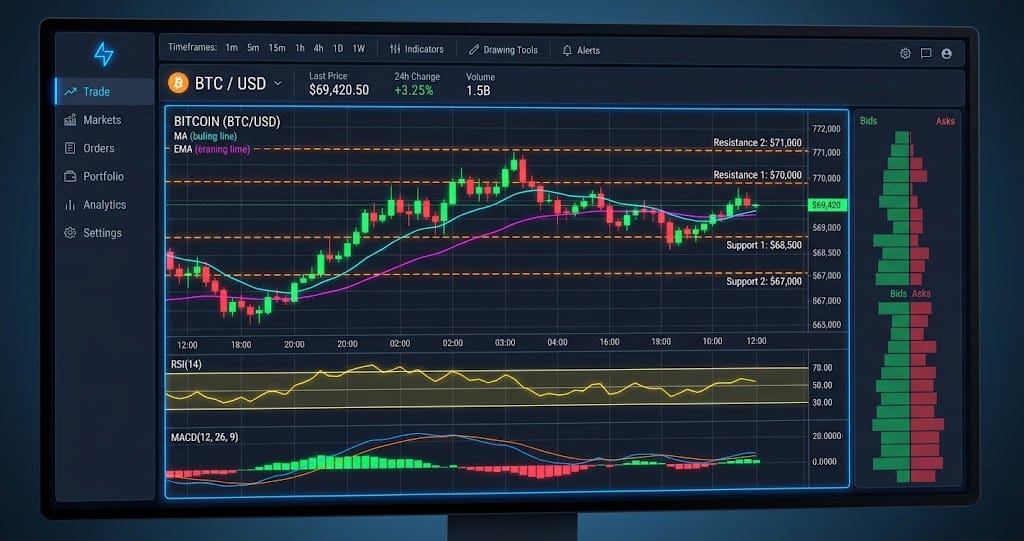
Interactive chart — switch timeframes, toggle indicators, hover for OHLC data
Market Structure
SOL trades at $96.39 as of August 26, 2026, with EMA20 at $85.23 and EMA50 at $80.40, keeping the medium-term trend bullish despite a conflicted signal score of 15. RSI at 80.1 and BB %B at 89.3% show stretched momentum, while $100.19 is the immediate resistance and $89.41 is the key EMA200 support.
Key Levels
| Price | Type | Source | Significance | Distance |
|---|---|---|---|---|
| $119.23 | Resistance | Pivot R3 | Low | +23.7% |
| $111.14 | Resistance | Pivot R2 | Medium | +15.3% |
| $103.76 | Resistance | Pivot R1 | Medium | +7.6% |
| $100.19 | Resistance | BB Upper | Low | +3.9% |
| $96.39 | Current | — | — | — |
| $89.41 | Support | EMA200 | High | -7.2% |
| $88.29 | Support | Pivot S1 | Medium | -8.4% |
| $85.23 | Support | EMA20 | Low | -11.6% |
| $80.20 | Support | Pivot S2 | Medium | -16.8% |
Moving Averages
| MA | Value | Position | Signal |
|---|---|---|---|
| EMA 20 | $85.23 | Above | Bullish |
| EMA 50 | $80.40 | Above | Bullish |
| EMA 200 | $89.41 | Above | Bullish |
| BB Middle (SMA 20) | $82.51 | Above | Bullish |
Volume Analysis
Volume is only 0.57x average as of August 26, 2026, which weakens confirmation of the move toward $100.19. The 2.01 long/short ratio and 0.0055% funding rate show bullish positioning, but the sub-average volume means a breakout above $100.19 needs stronger participation to become credible.
Technical Indicators
Trade Setup
Scenario Analysis
Bullish Case
Trigger: SOL closes above $100.19 with volume rising above 1.0x average
Target: $108.50
Invalidation: $96.39
A confirmed break above the $100.19 BB Upper could extend the current momentum, with RSI already at 80.1 and price $11.16 above EMA20. The bullish case requires volume to recover from 0.57x average; without that confirmation, the $100.19 breakout remains vulnerable to rejection.
Base Case
Trigger: SOL remains between $89.41 and $100.19 while volume stays below 1.0x average
Target: $92.00-$99.50
Invalidation: Daily close below $89.41
The base case is consolidation because SOL is near $100.19 resistance while volume is only 0.57x average and the signal score is a conflicted 15. Holding $89.41 would preserve the broader bullish structure, while RSI at 80.1 leaves room for a cooling phase without requiring a trend reversal.
Bearish Case
Trigger: SOL closes below $89.41 with volume above 1.0x average
Target: $85.23-$80.40
Invalidation: Close back above $100.19
A decisive break below $89.41 would weaken the current structure and expose EMA20 at $85.23, followed by EMA50 at $80.40. The bearish case becomes more credible if volume expands above 1.0x average, because the current 0.57x reading does not yet confirm sustained selling pressure.
Analysis Summary
Solana (SOL) Resources